In a online instance we do not have that much flexibility to debug the plug-in, as we do not have the server on-premise and access to it. To get away with this scenario and debug a CRM Online plug-in we can do that using Plugin Registration Tool by Installing Plugin Profiler and attaching the debug process to the step of our plugin.
CRM Online version we cannot have a real-time debugger when the application is running, to simulate this Plugin profiler stores the profiled component into a exception log or an entity (based on user selection) and provides ability to debug the plugin in an simulated environment.
Below is the Step-by-Step process to achieve this:
- Open Plugin Registration Tool
- Install Plugin Profiler
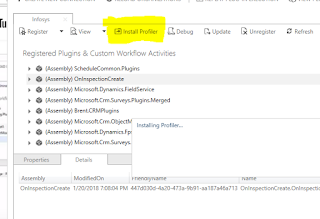
- Once Profiler is installed successfully, you should see "Plugin Profiler" in Registered Plugin section


- Go to the step of your plugin where you would like to debug and click on "Start Profiling"

- I will be storing the Profiled component into an Exception and continuing with debug process. as shown below you can also store it into an entity and proceed.

- Plugin step will be marked as (Profiled), as shown below

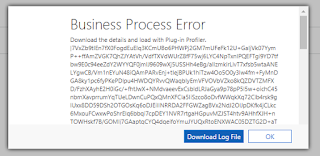
- Open your CRM Instance and perform the required action to trigger plugin. As a result of our profiler settings, once the operation is completed, the profile information will be presented as a 'Business Process Error'. Just download log file.
- At this point you have Profile Information which you need to debug, this will be done with plug-in registration tool. before that we need to attach plugin registration tool process to visual studio to debug.
- Click Debug on Plugin Registration Tool

- Three steps need to be performed here
- Profile: Browse the log file which we downloaded from CRM Instance
- Assembly Location: Browse the plugin .dll from BIN folder of .csproj
- Keep Track of Process Id displayed for Plugin Registration tool to attach to VS.


- Open Visual Studio > Debug > Attach To Process > Find by PID

- You are there.. Ready to go.. Keep a breakpoint in your code and Hit "Start Execution" on Plugin Registration Tool Debug popup. Voila!

As debug point is there, you can perform all the steps which you do with debugging.. as seen below entity information can also be seen in immediate window.

Hope this helps some one.. See you soon with another post!!
Comments
Post a Comment